GitViz - a GitHub Visualization tool
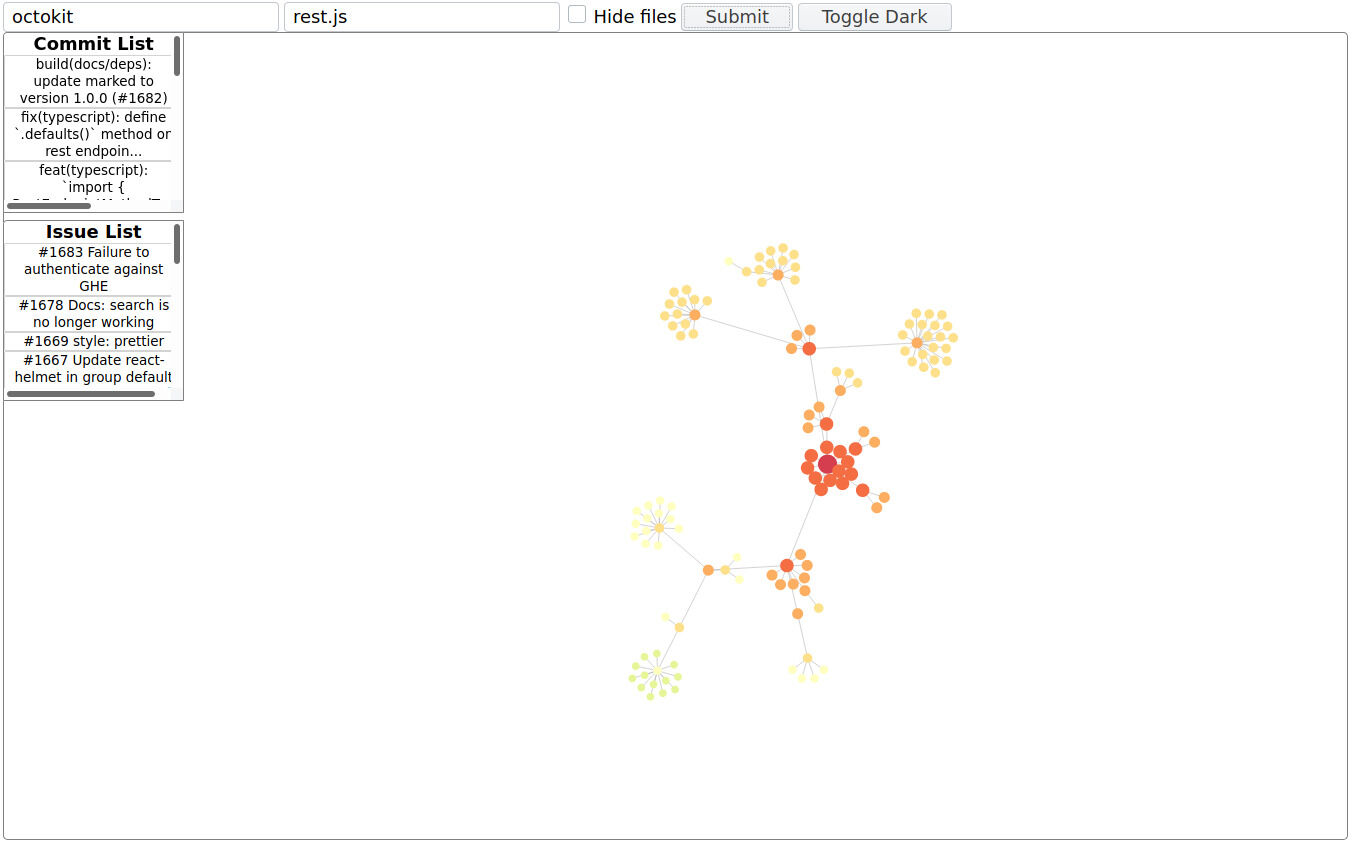
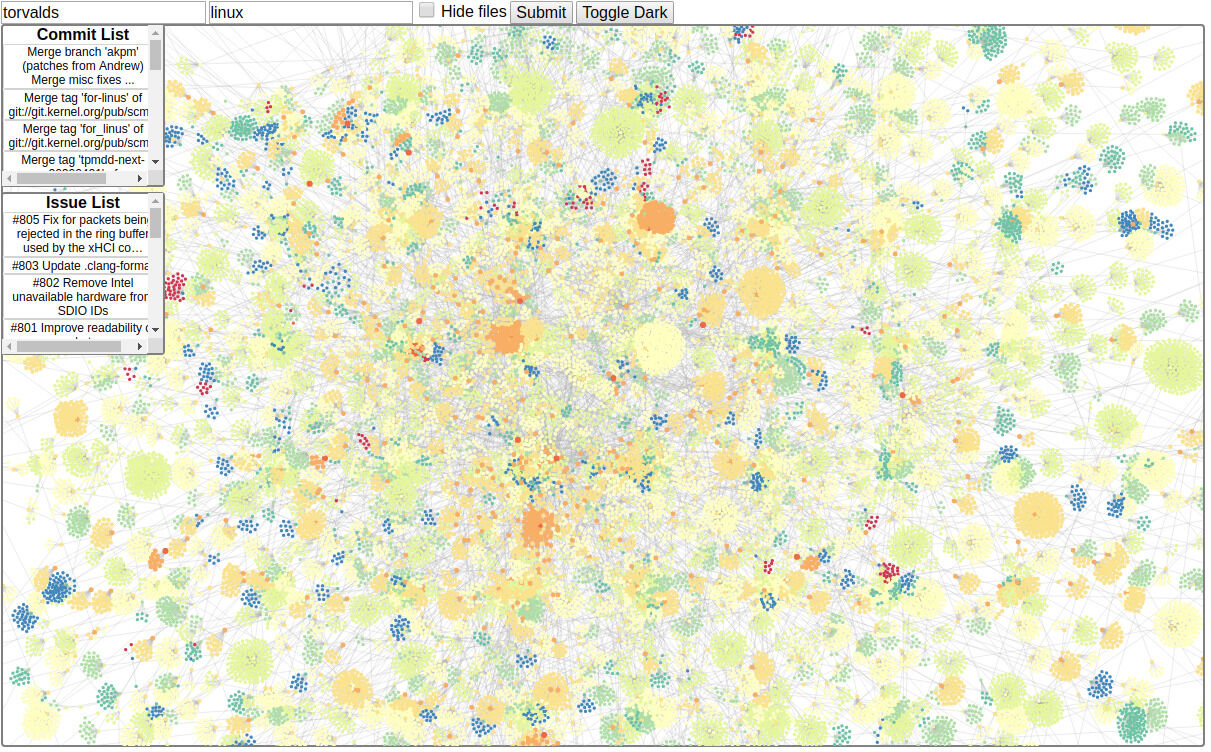
For my bachelor thesis, my partner and I developed GitViz, a tool to visualize GitHub data. The central graph displays repo files and directories as nodes, with colors and sizes indicating their distance from the root. The visualization is interactive, allowing for dragging and scrolling. There are two menus on the left: one for navigating commits and viewing the file tree at different points in time, and another for viewing issues. We also added a dark mode, a modern necessity. While the tool works well for smaller repositories, it struggles with larger ones.
Project Link
Screenshots